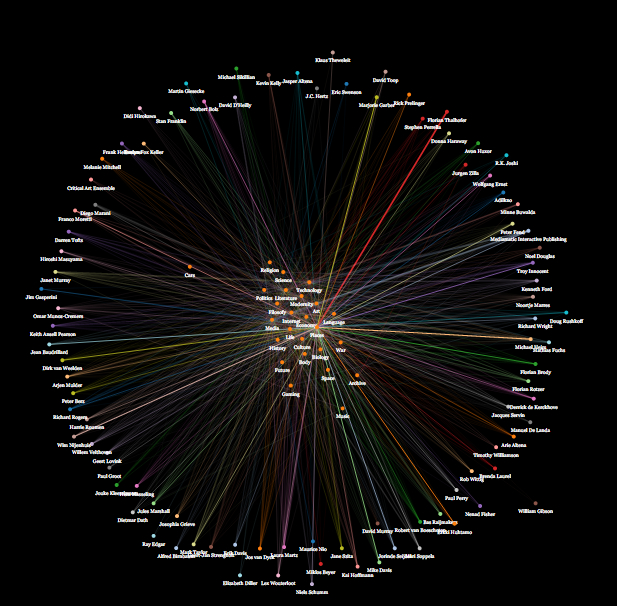
I chose to do an analysis of the content of these magazines because it is a nice way to get an overview of all the changes the magazine went through. And as I have said before in one of my earlier blogs, it is important to not only try to preserve the magazine, but you have to remember it as well. And doing an analysis of the content and visualizing the results seemed to me a great way to remember Mediamatic Magazine.
Scraping the website
The first step, before I can start analyzing, is gathering the data. Because all the articles of the magazines are visible on the website I started scraping all the articles from 1994 till 1999. After the scraping was done, I had a CSV file with the author, the year of publishing, the content and the number of the magazine for every article.
Analyzing
In the analysis I mainly focus on the different subjects in the magazine and what influence the authors have on these subjects. I wrote a script in the programming language ‘Python’ that made a list of the 50 most common words of each article. These words I divided into 25 meaningful subjects. The script then checked if these subjects were to be found in each article by counting how many words from the 25 subjects occurred in the articles. These scores are divided by the total amount of words to prevent the scores of articles with many words to be higher than of the articles with les words. As a last step I calculated the mean score for each author.
Visualizing
Because a spreadsheet is no fun to look at, I decided to visualize the results of my research using a ‘Javascript library' called d3.js. In the visualization you can see which authors wrote about which subjects and how much. For example you can see that Jürgen Zilla mostly writes about music, and that the subject most written about is media.
